
Dashboard
- Supervisor
- Administrator
- Auditor
The dashboard is the first screen after you sign in. It answers “how is collection going?” for the period you choose.
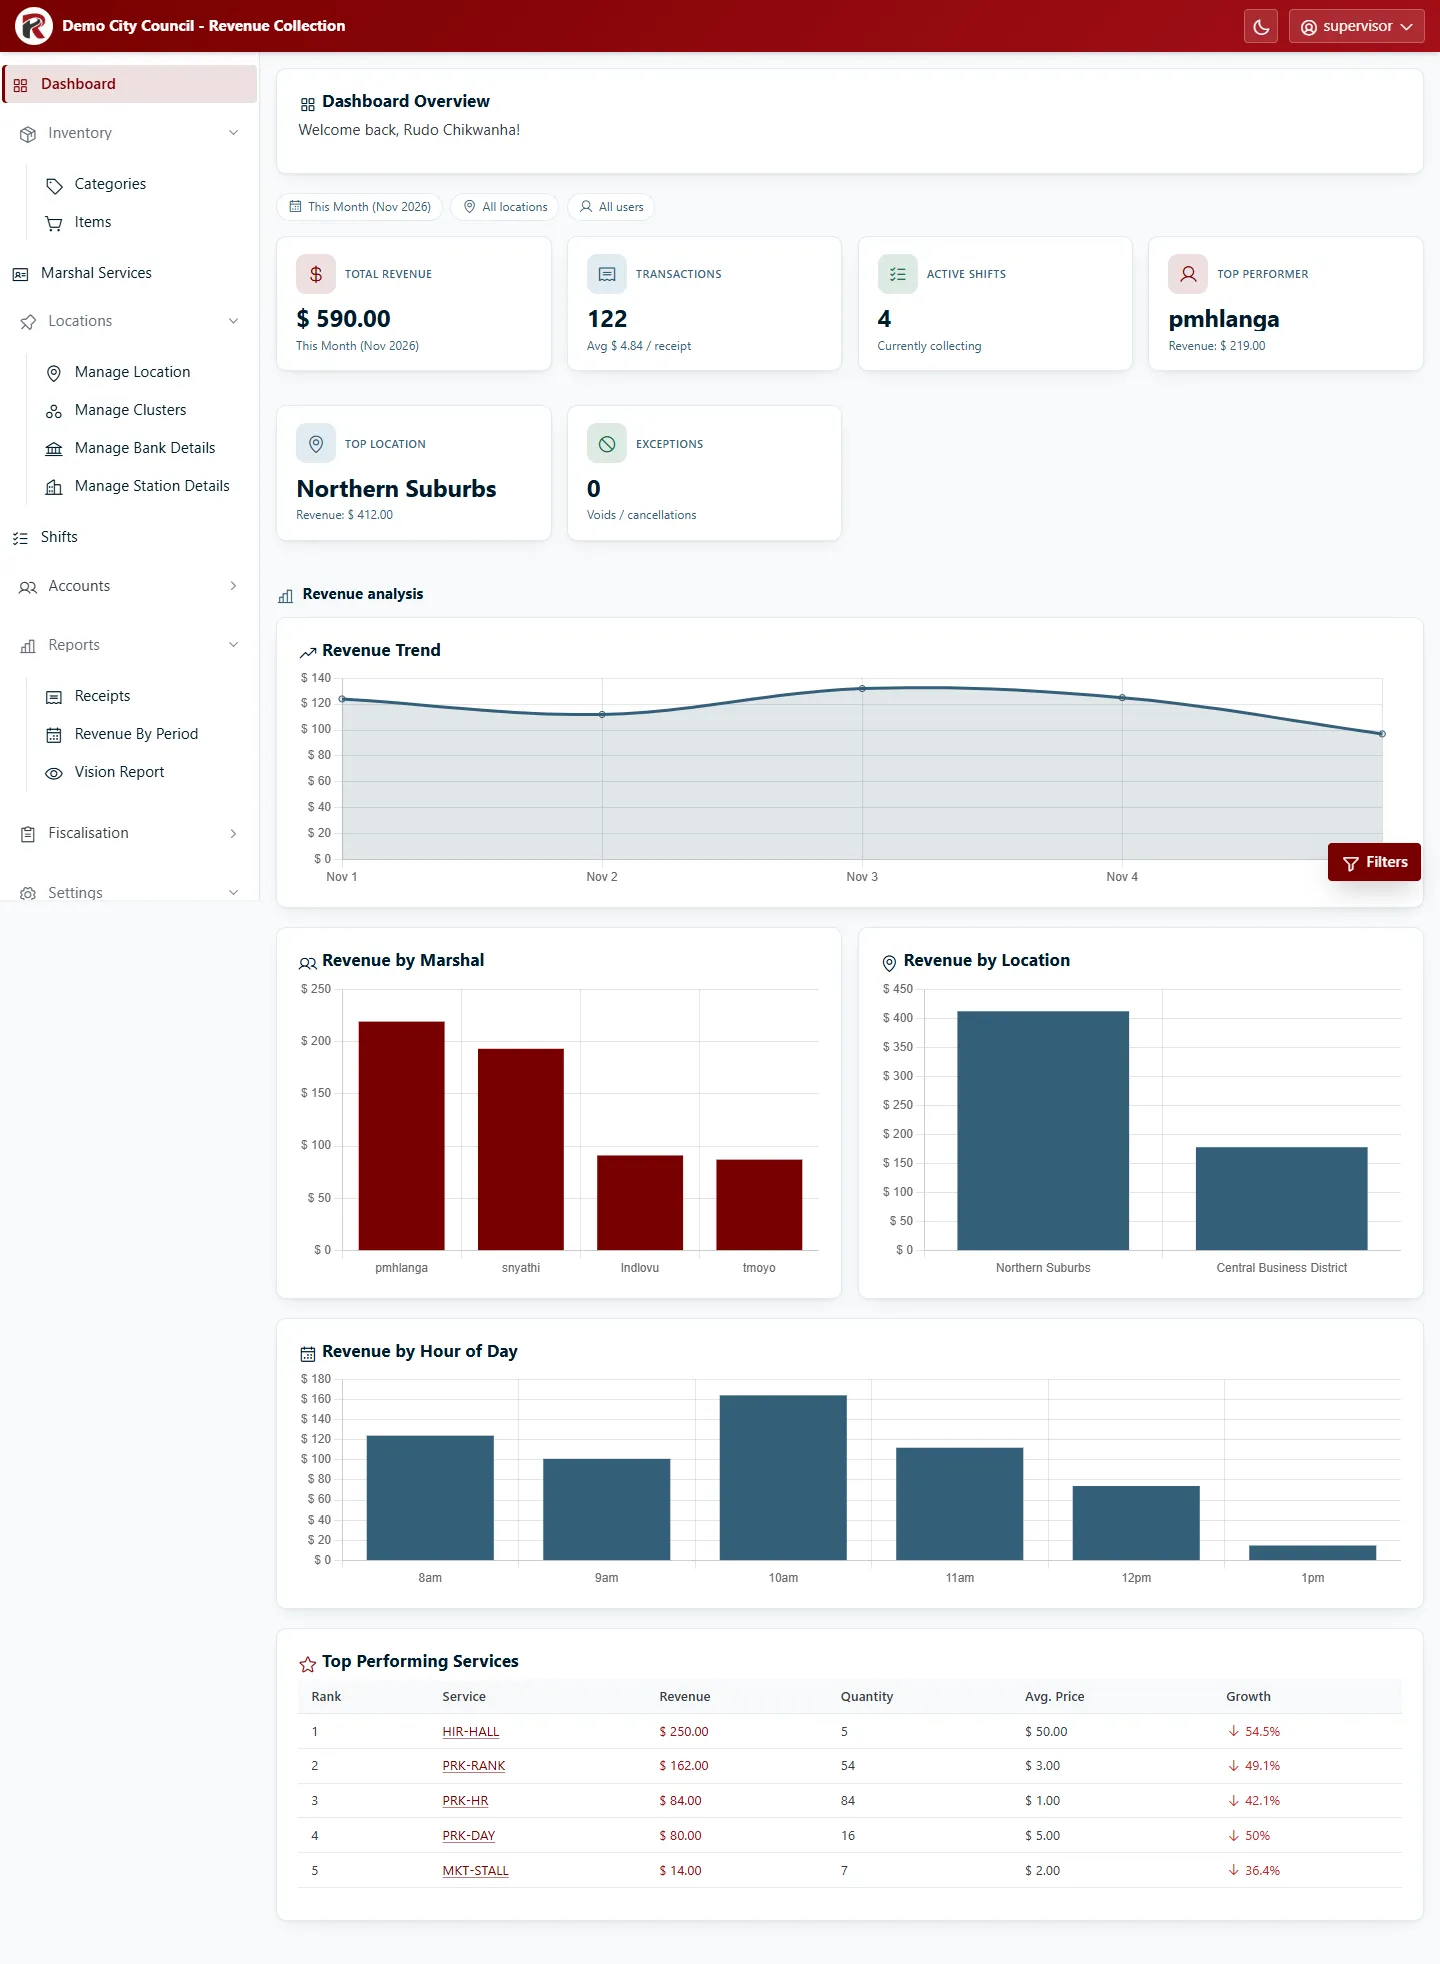
The headline figures
Section titled “The headline figures”| Card | What it shows |
|---|---|
| Total Revenue | Money collected in the selected period. |
| Transactions | Number of receipts issued, with the average value per receipt. |
| Active Shifts | Shifts that are currently collecting (started, not yet closed). |
| Top Performer | The marshal who collected the most, and how much. |
| Top Location | The location that brought in the most revenue. |
| Exceptions | Voids and cancellations in the period. Anything above zero is worth a look. |
Revenue analysis
Section titled “Revenue analysis”Below the cards:
- Revenue Trend: daily revenue across the period.
- Revenue by Marshal and Revenue by Location: who and where.
- Revenue by Hour of Day: when collection happens, useful for planning shifts.
- Top Performing Services: the services that earned the most, with quantity, average price and growth on the previous period.
Change what you’re looking at
Section titled “Change what you’re looking at”The chips above the cards show the current period, location and user. To change them, select Filters (bottom right).
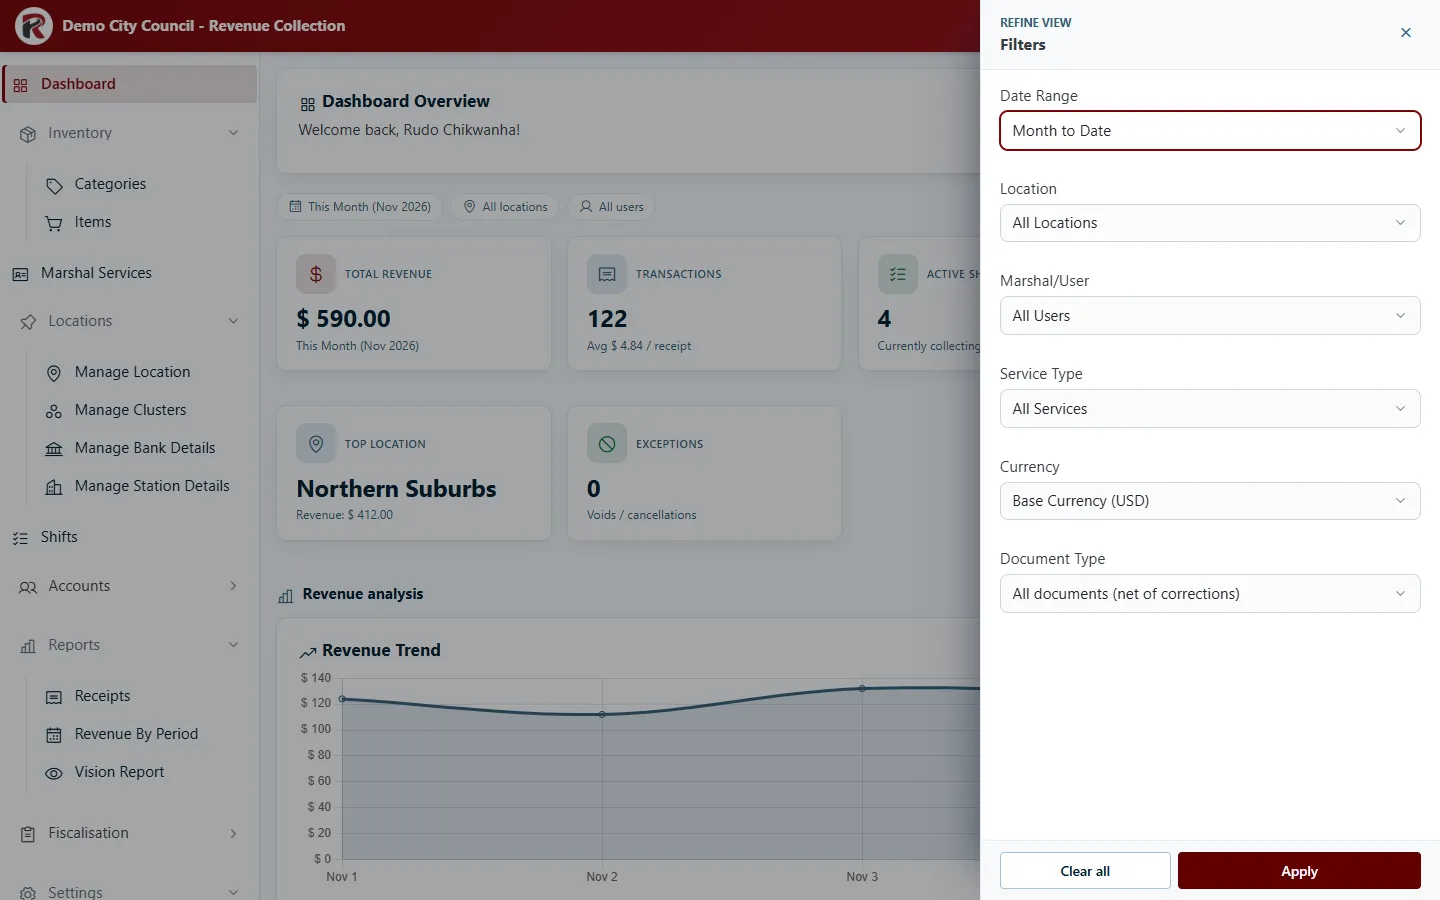
You can filter by Date Range (or your own Start Date and End Date), Location, Marshal/User, Service Type, Currency and Document Type. Select Apply; every card and chart updates together.
RevColl user manual · build 19463 · Axis Solutions · Back to RevColl